Ya.Digital Project by Yarmarka and abgroup.tech Nominated for Data Award 2026
Grafana is a powerful tool for monitoring and exploring data in the field of information technology. This free platform allows users to create informative dashboards that gather all the key information for administrators and business analysts. It supports a wide range of data sources (Prometheus, InfluxDB, Elasticsearch, MySQL, PostgreSQL, Loki, etc.) and enables the creation of interactive dashboards with graphs, tables, alerts, and annotations.
One of the main advantages of Grafana is its ability to combine different types of data (metrics, logs, and traces) into a single user-friendly interface. With flexible configuration and a variety of visualization options, users can monitor the performance of applications and servers in real-time and conduct detailed performance analysis.

Key Benefits:
• Convenient alerting: Receive instant notifications about issues.
• Large community: Easy to find solutions and share experiences.
• Good documentation: Plenty of information on setting up monitoring.
• Intuitive interface: Quickly learned.
• Monitoring capabilities.

Currently, we are monitoring:
- The status of all servers
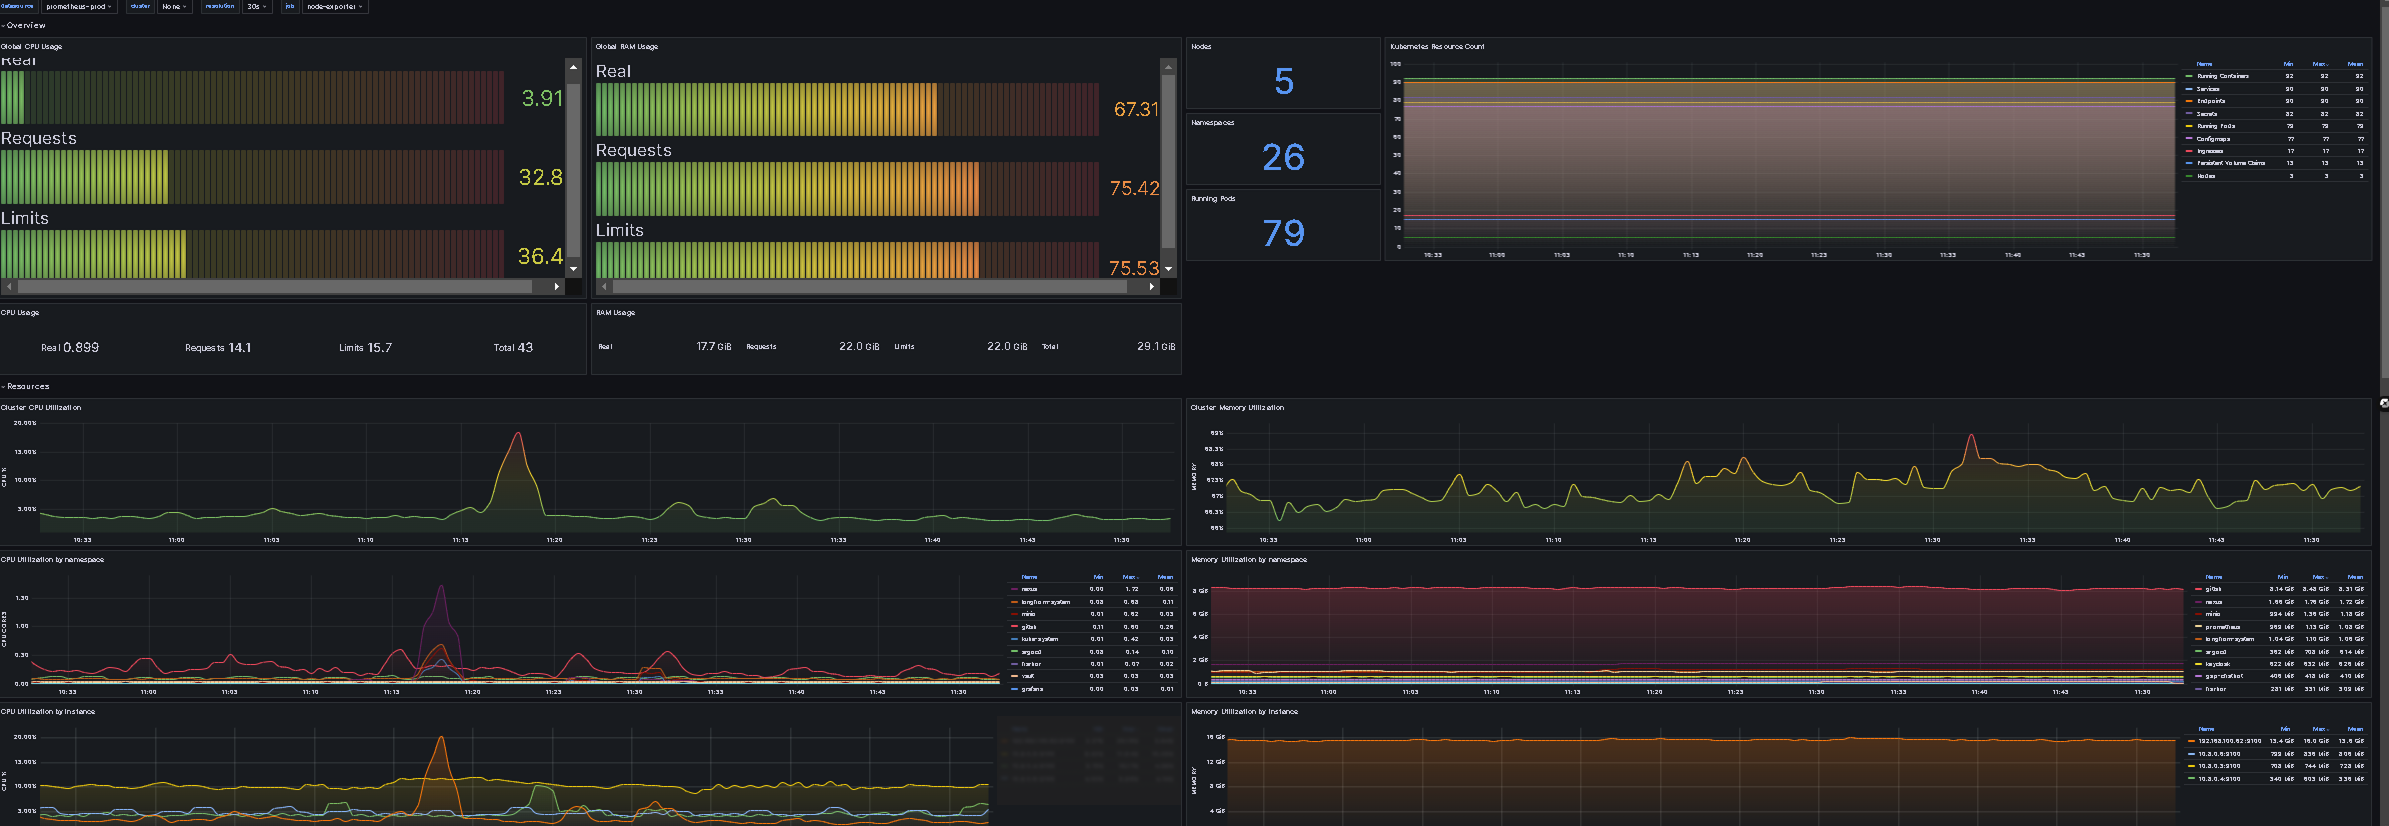
- Resource consumption
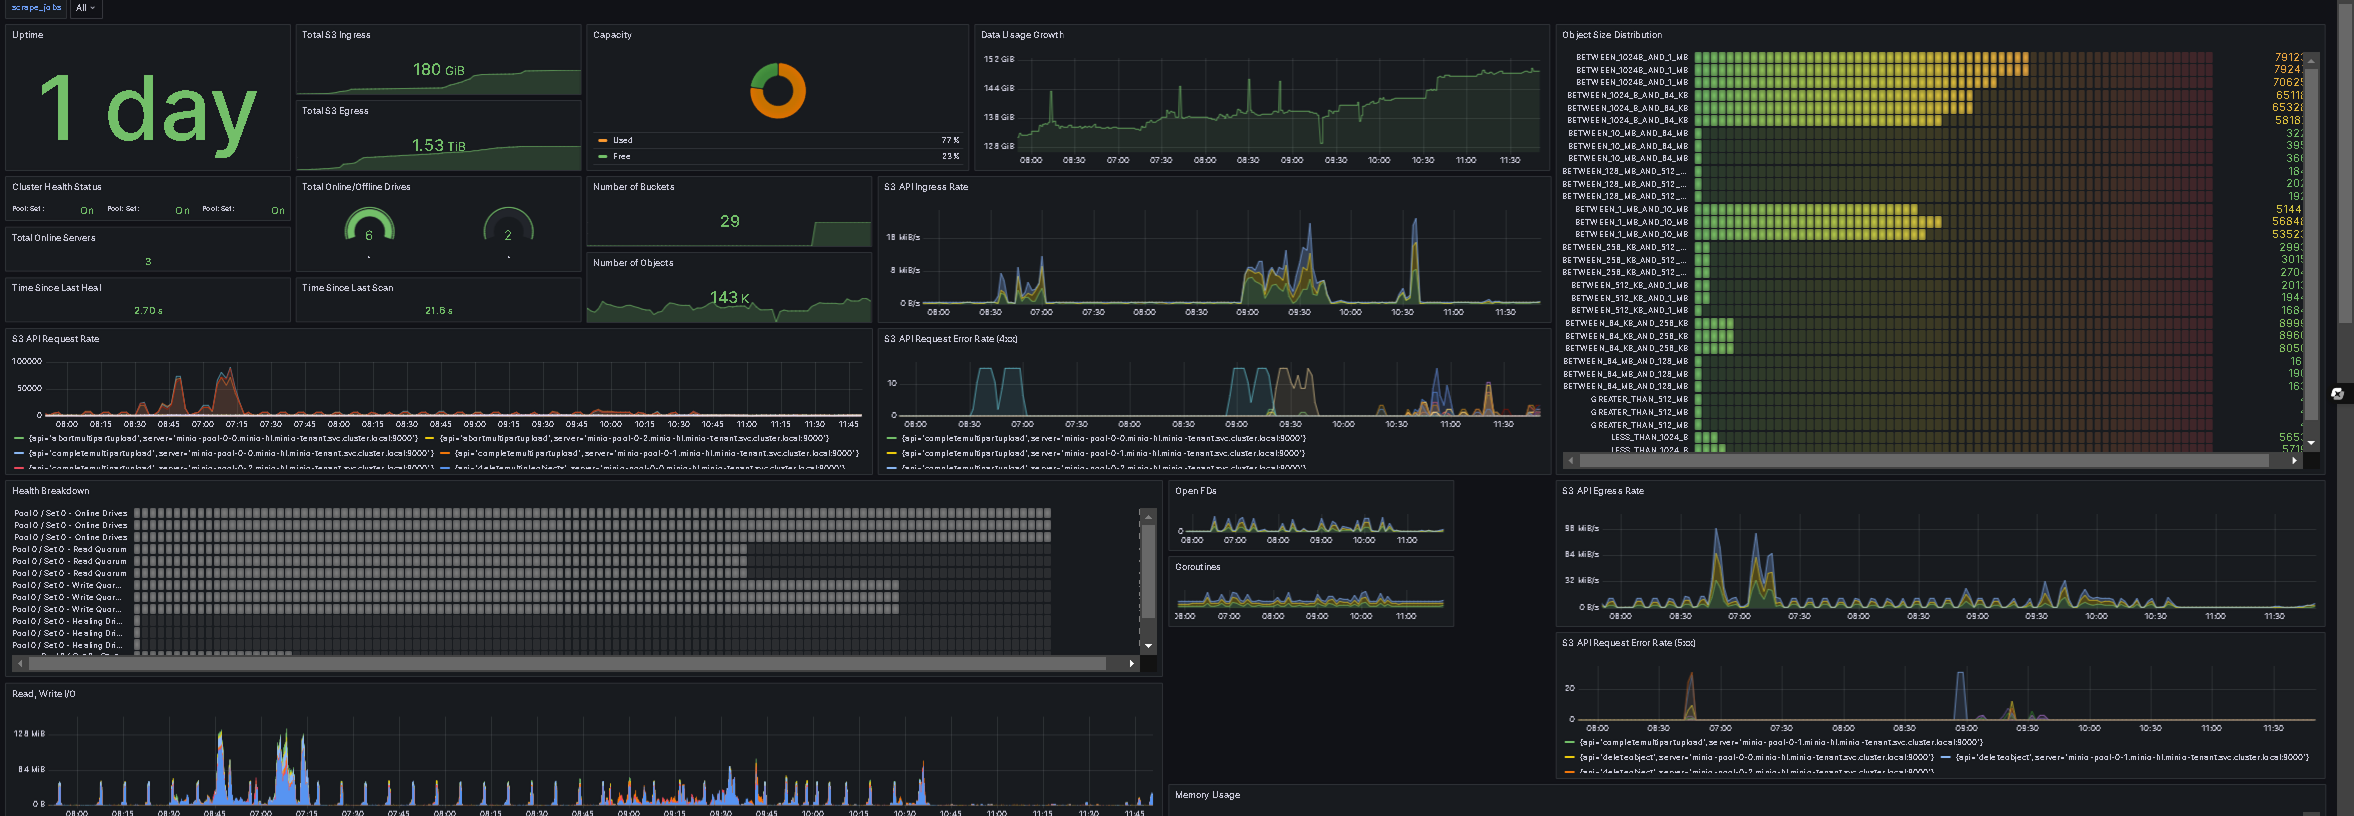
- Service operation (ClickHouse, MinIO, S3, ArgoCD)
When problems arise, Grafana sends notifications to Telegram, allowing us to quickly respond to issues.
Currently, we are monitoring:
1. The status of all servers.
2. Resource consumption.
3. The operation of services (ClickHouse, MinIO, S3, ArgoCD).
In case of issues, Grafana sends notifications to Telegram, allowing for quick responses to malfunctions.
How Grafana Helps Us Daily:
Data Visualization:
1. Collecting server metrics (memory, CPU, disk usage, monitoring virtual servers Proxmox).
2. Collecting metrics from applications (ClickHouse, MinIO, Trino, etc.).
3. Collecting metrics from network equipment (Mikrotik and access points).
Automatic Alerts about Problems:
1. Ability to set up alert rules for any resources displayed in Grafana.
2. With alerts, we can immediately track problems and resolve them quickly.
"Incident Investigation" Tactics
What does it do?
Allows us to "rewind time" and see what happened at the moment of failure.
Integrates with Jaeger/Tempo for request tracing.
What is the benefit?
Reduces diagnosis time from hours to minutes.
Provides a complete picture (metrics + logs).
Example:
An alert "High latency" comes in:
1. Open Grafana → check the metrics of the application or server.
2. Identify an abnormal increase in response time or resource usage.
3. (Optional) Go to Loki → filter logs.