OpenForm by abgroup.tech — Reporting Automation System | Russian SW Registry
.png&w=1200&q=100)
Development of corporate analytics web-service interface
It all starts with gathering requirements that outline the product's objectives and goals,
for example, to reduce losses or downtime. Accordingly, the business analyst needs to determine what it is planned to do, what metrics need to be monitored, with what frequency, and at what granularity.

Further, it is already determined in what form this information can be provided - there are several criteria for this:
- customer wishes: products used, accepted visualization methods;
- common experience, use of products and visualizations that have already been implemented;
- the vision of the development team.
Custom development of services for corporate analytics certainly implies constant interaction with the client, who translates business requirements to the final product. The terms of reference most often include not only wishes for design, analysis of this or that information with visual graphs, but also a focus on those products that the client used in his work before the need for an individual product appeared. These could be box solutions, or a whole system of different programs (for example, 1C, Excel, paper media) - that is, a large amount of disparate data that requires constant calculations and analytics.

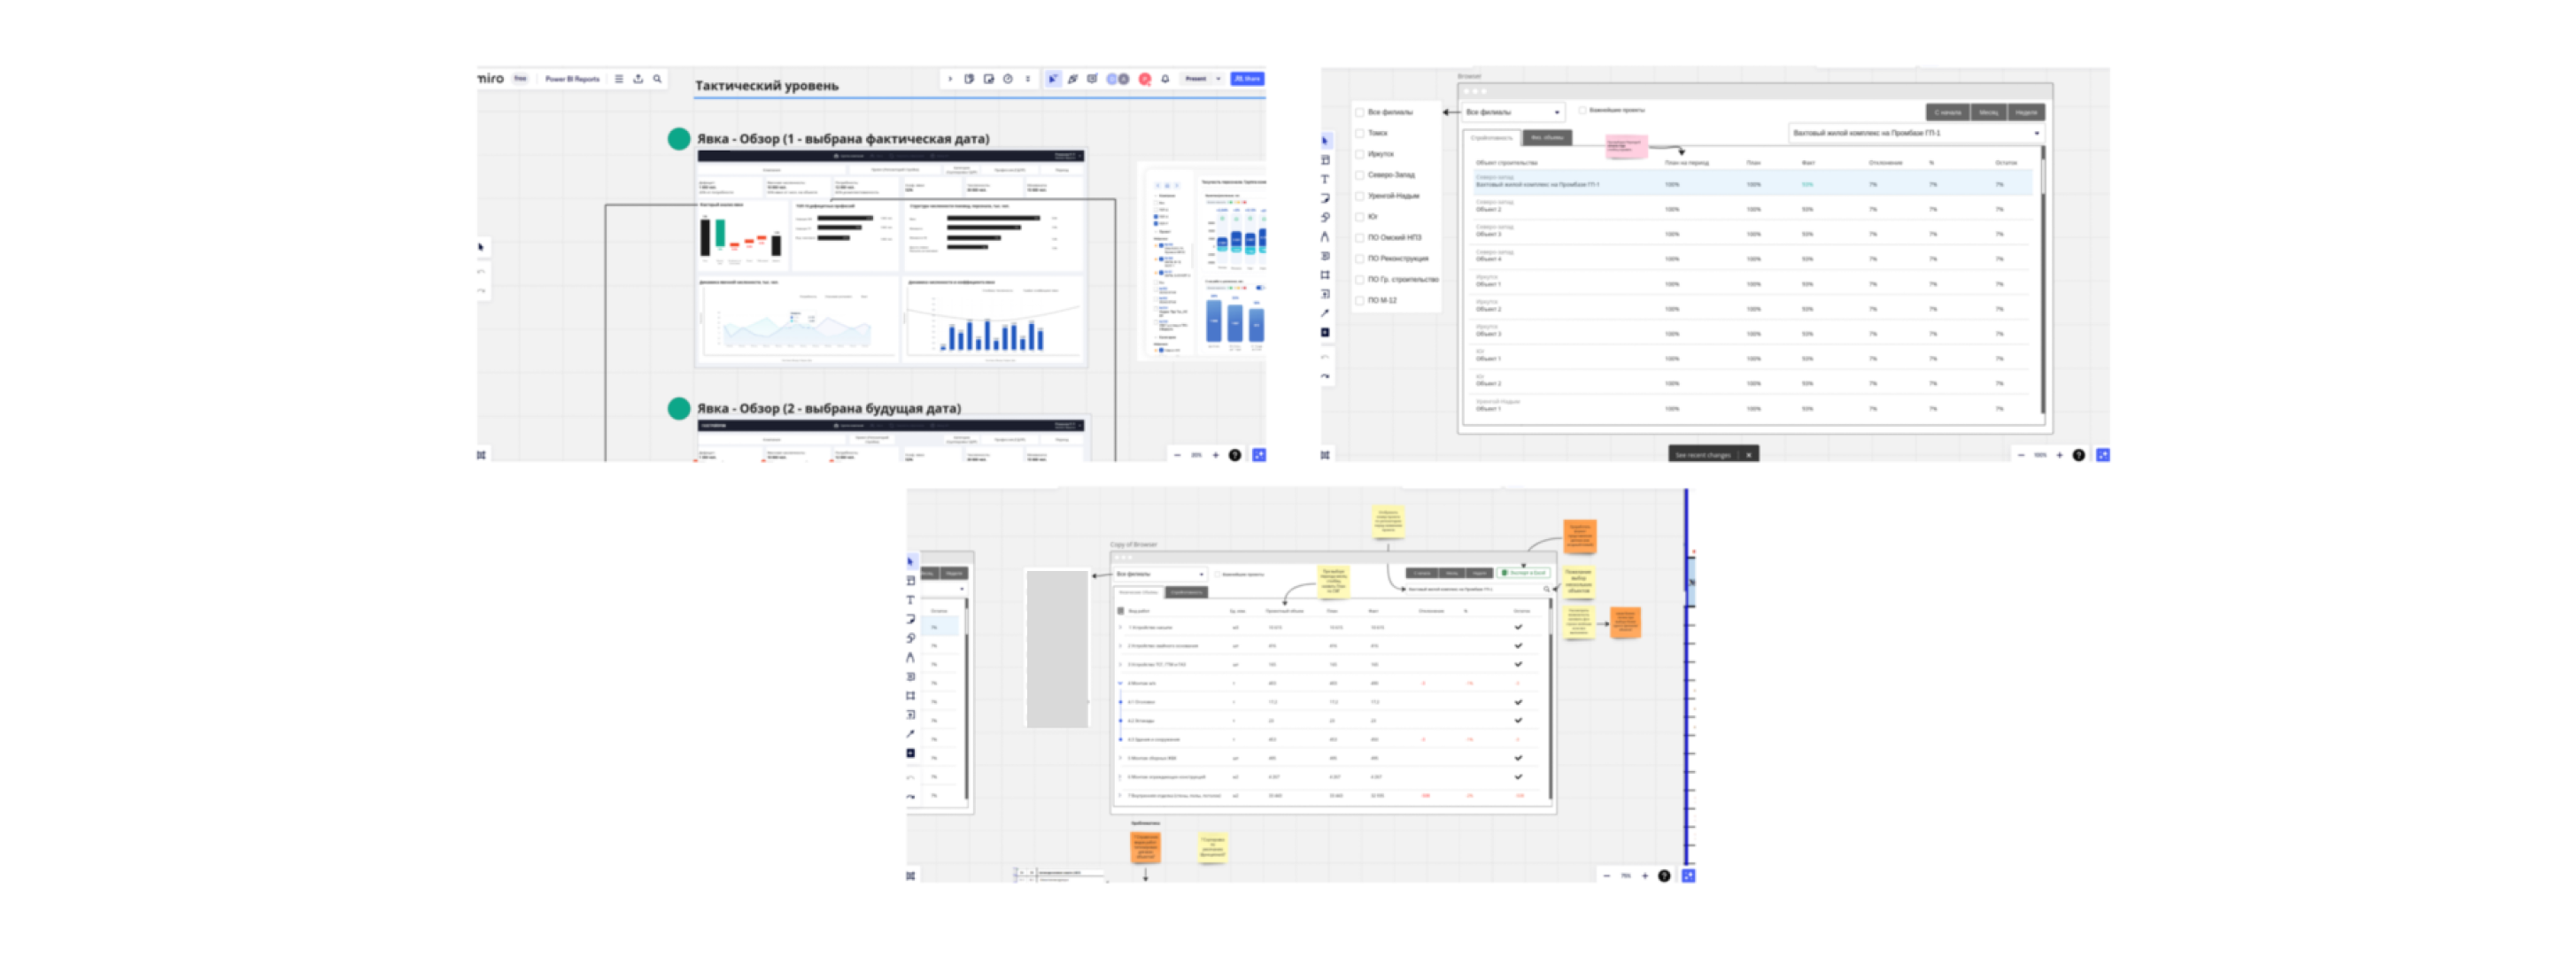
After that, sketches from analysts are born: how the data will be arranged, filters - simple blocks without details, colors. This layout is coordinated with the customer and then given to the designer.
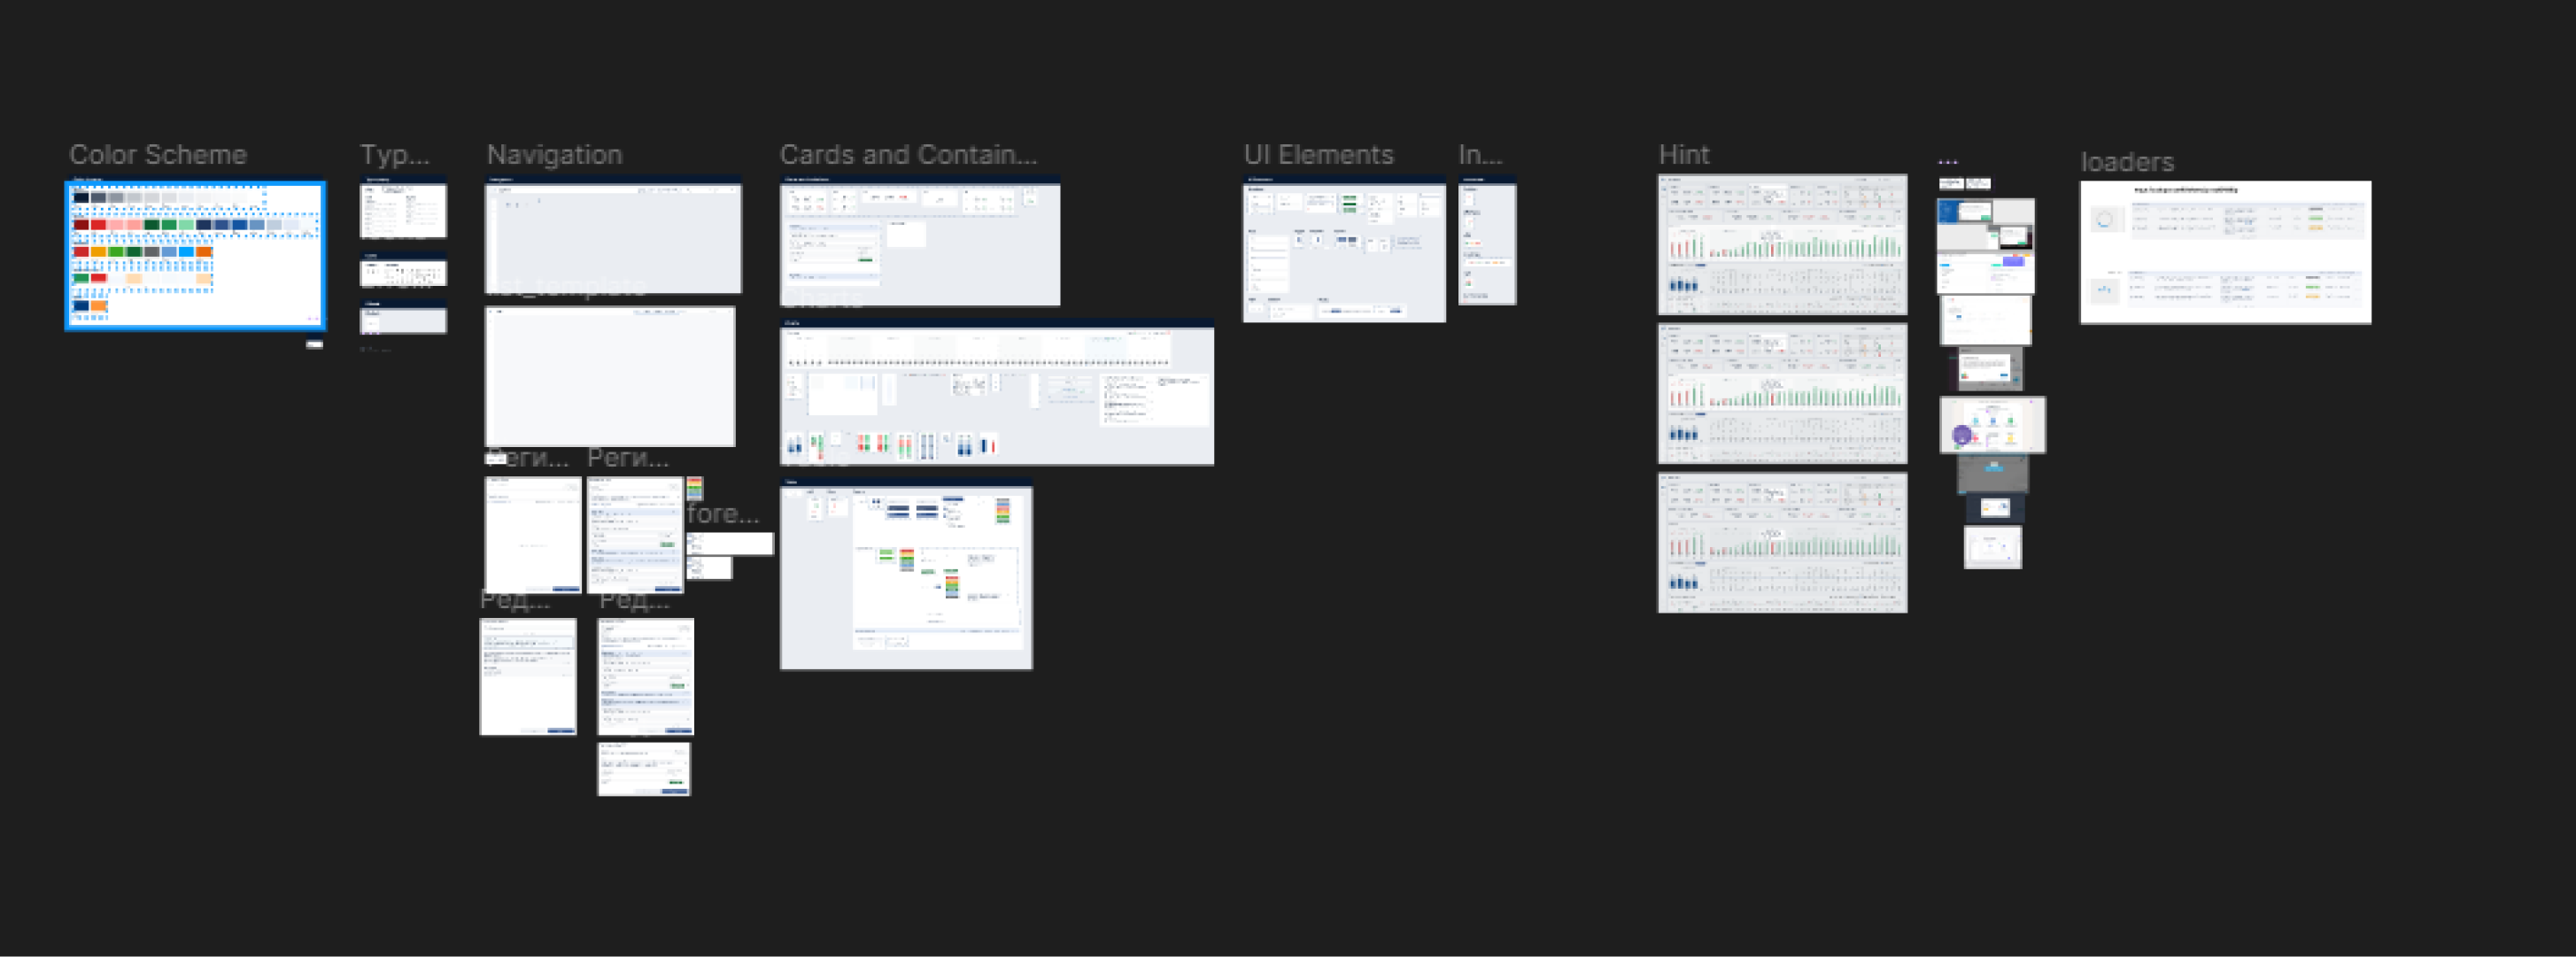
An important aspect of the designer's work on analytics services is understanding the logic of the project; either analysts immerse him in the project, or if possible, you can contact the client directly.
Analysts and designers have a preliminary idea of what the interface developer can and cannot implement, but most often during the design development the specialists have a dialog and advise on how to better reflect this or that function with the least time and labor costs.

The main nuance is the large amount of business logic (Business logic - in information systems development - a set of rules, principles, dependencies of behavior of objects of the subject area) in the technical specification, which is not only processed by the server, but also displayed directly on the user interface. For example, the role structure of the service - which means that the interface changes depending on the number of "rights" of the user, as well as the possibility of dynamic changes by the user (independent addition of new windows, graphs, cells and values).
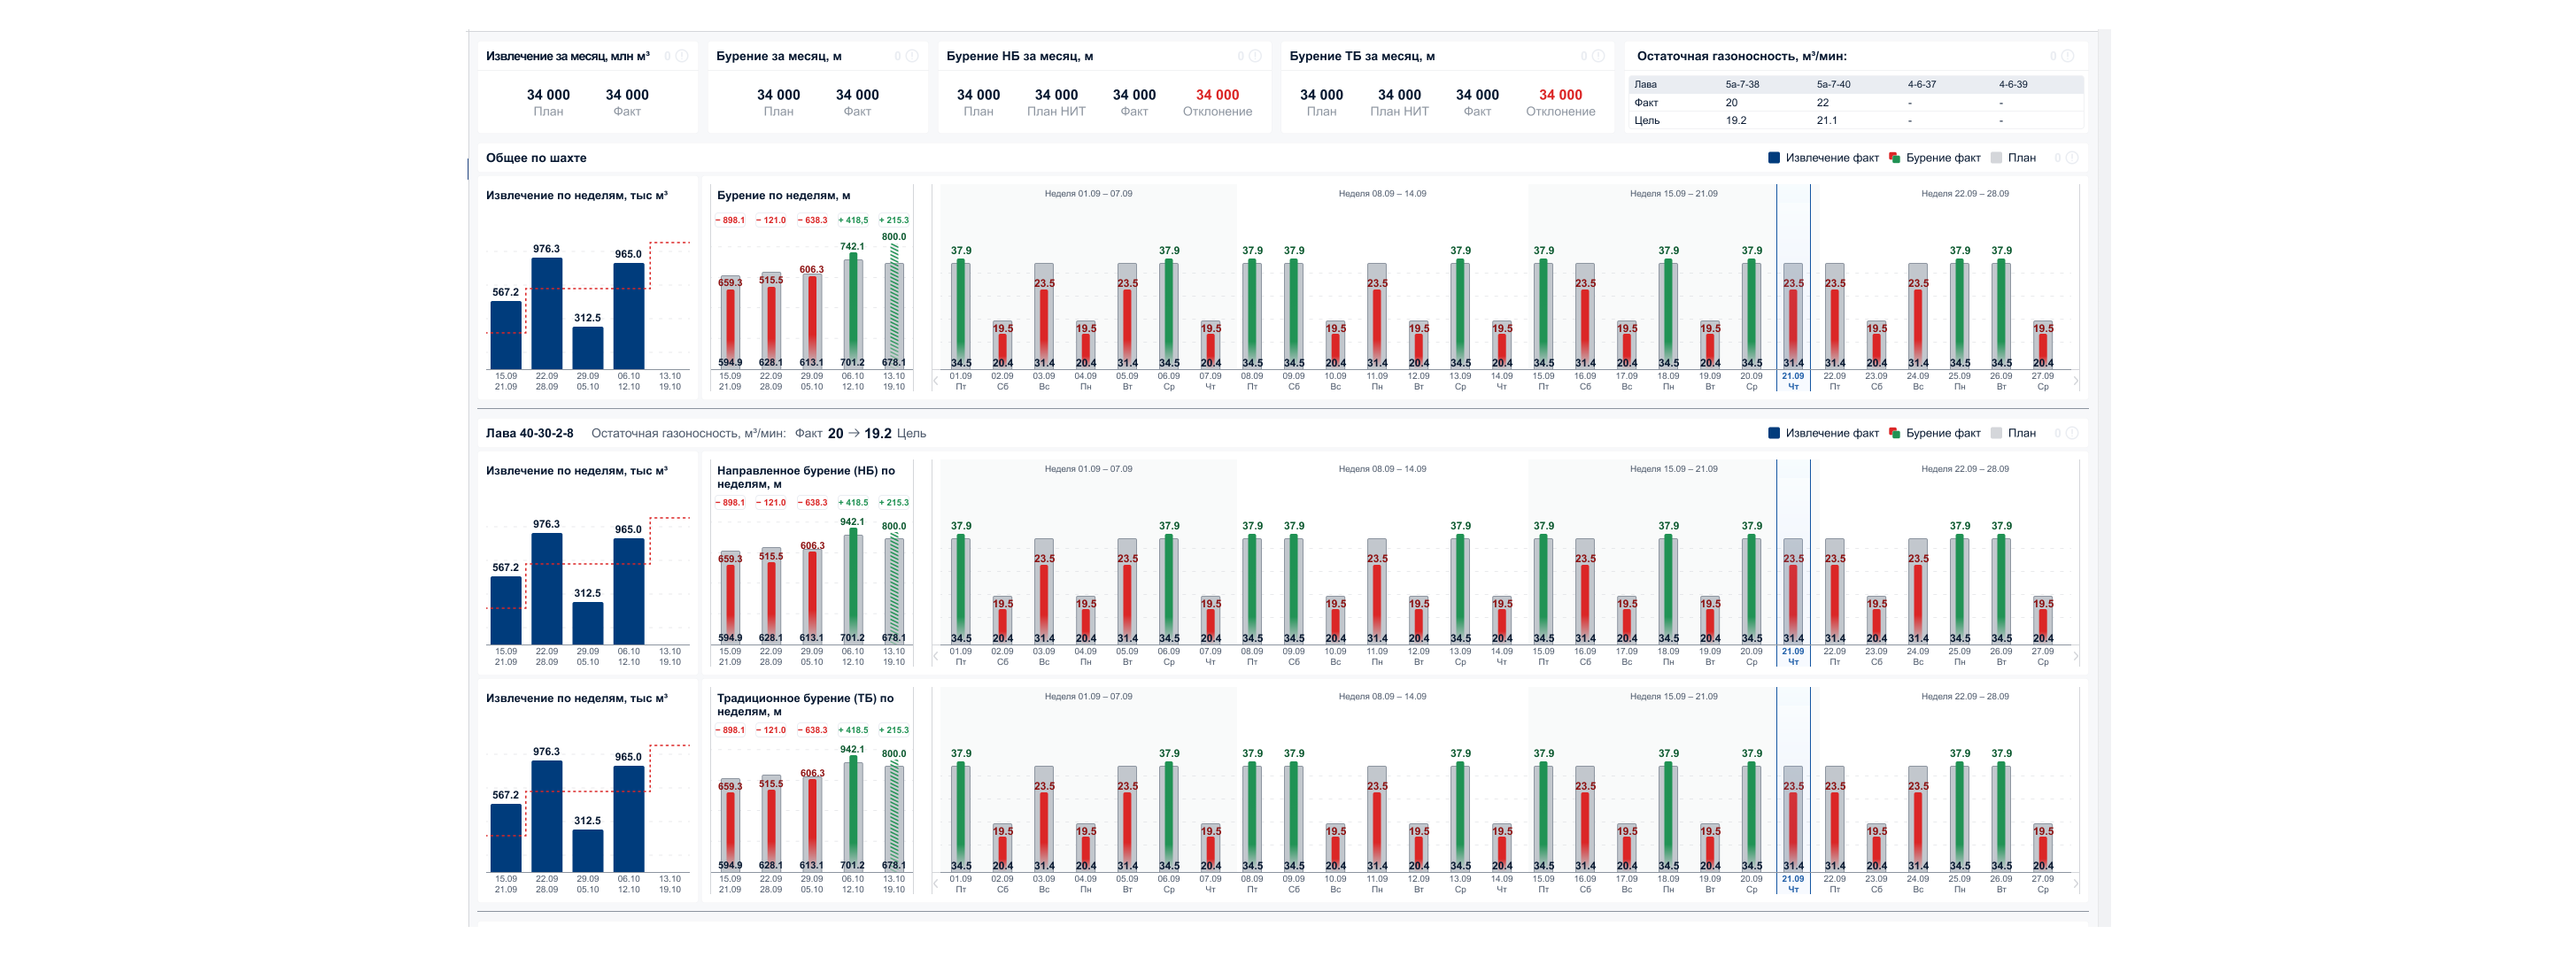
The selected toolkit also plays an important role in the analytical service project, namely frameworks, code libraries, architectural solutions, and importantly - the composition of the team. Data visualization is a link of tools and logic, it is important for competent analytics and easy perception of the data array, which is processed by the server part of the project.
Of course, almost all of the above aspects are important in any custom development, and the main difference can be called the logic of projects, to create a quality service requires full immersion in the business processes of the customer.
.jpg&w=1024&q=75)