Optimizing Data Pipelines with Apache Iceberg and S3: How We Accelerated Parquet Processing

Complex of Dashboards for Sales Analytics Based on Yandex Cloud with Visualization in DataLens
The client was interested in the ability to visualize and analyze data on secondary sales to better understand how products are sold through distributors and retail points, as well as the dynamics and geography of sales. However, there was some skepticism about whether this investment was worthwhile and necessary.
During interviews and the identification of all needs, we formulated the requirements that could be met by the complex of dashboards. After conducting interviews and gathering requirements, we began the process of data collection and integration of existing systems 1C and Cislink into the new architecture.

Cislink serves as the data source for secondary sales through distributors, providing information on the paths of product sales. 1C is the sales management system from which all data on primary sales is pulled.
For data visualization, we chose a service based on Yandex Cloud – DataLens. While it has some limitations, it is budget-friendly and intuitively understandable. Knowing its operational nuances and being a partner of YC, we immediately acted within its framework, considering DataLens's capabilities.
In developing the architecture, we initially planned to use PostgreSQL, which we were familiar with, and to deploy the corporate data warehouse in Yandex Cloud with stream orchestration via Airflow. The logic was scripted using DBT to keep everything in one place within the repository.
Cislink Integration
PostgreSQL struggled with complex logic, so we migrated to ClickHouse, as it does not require complex joins, optimizing the process. Cislink integrates with Postgres using a built-in plugin; a script from the internal database replica is placed on a YC virtual machine. Then, an SFTP server retrieves updated data from the replica and transfers it into the YC environment.
1C Integration
This occurs via Kafka; a handler was written for Kafka that monitors necessary entities, identifies changes, which are then read using the ClickHouse engine.

The further processing looks like this:
• Stage Layer: Initial access to raw data.
• ODS Layer: Data is normalized for further processing.
• DDS Layer: Data transformation into a data model for dashboards, establishing relationships between tables.
• DM Layer: Dashboard layer, where one dashboard equals one display.
Here are some examples of tools we developed for sales analytics in an FMCG company:
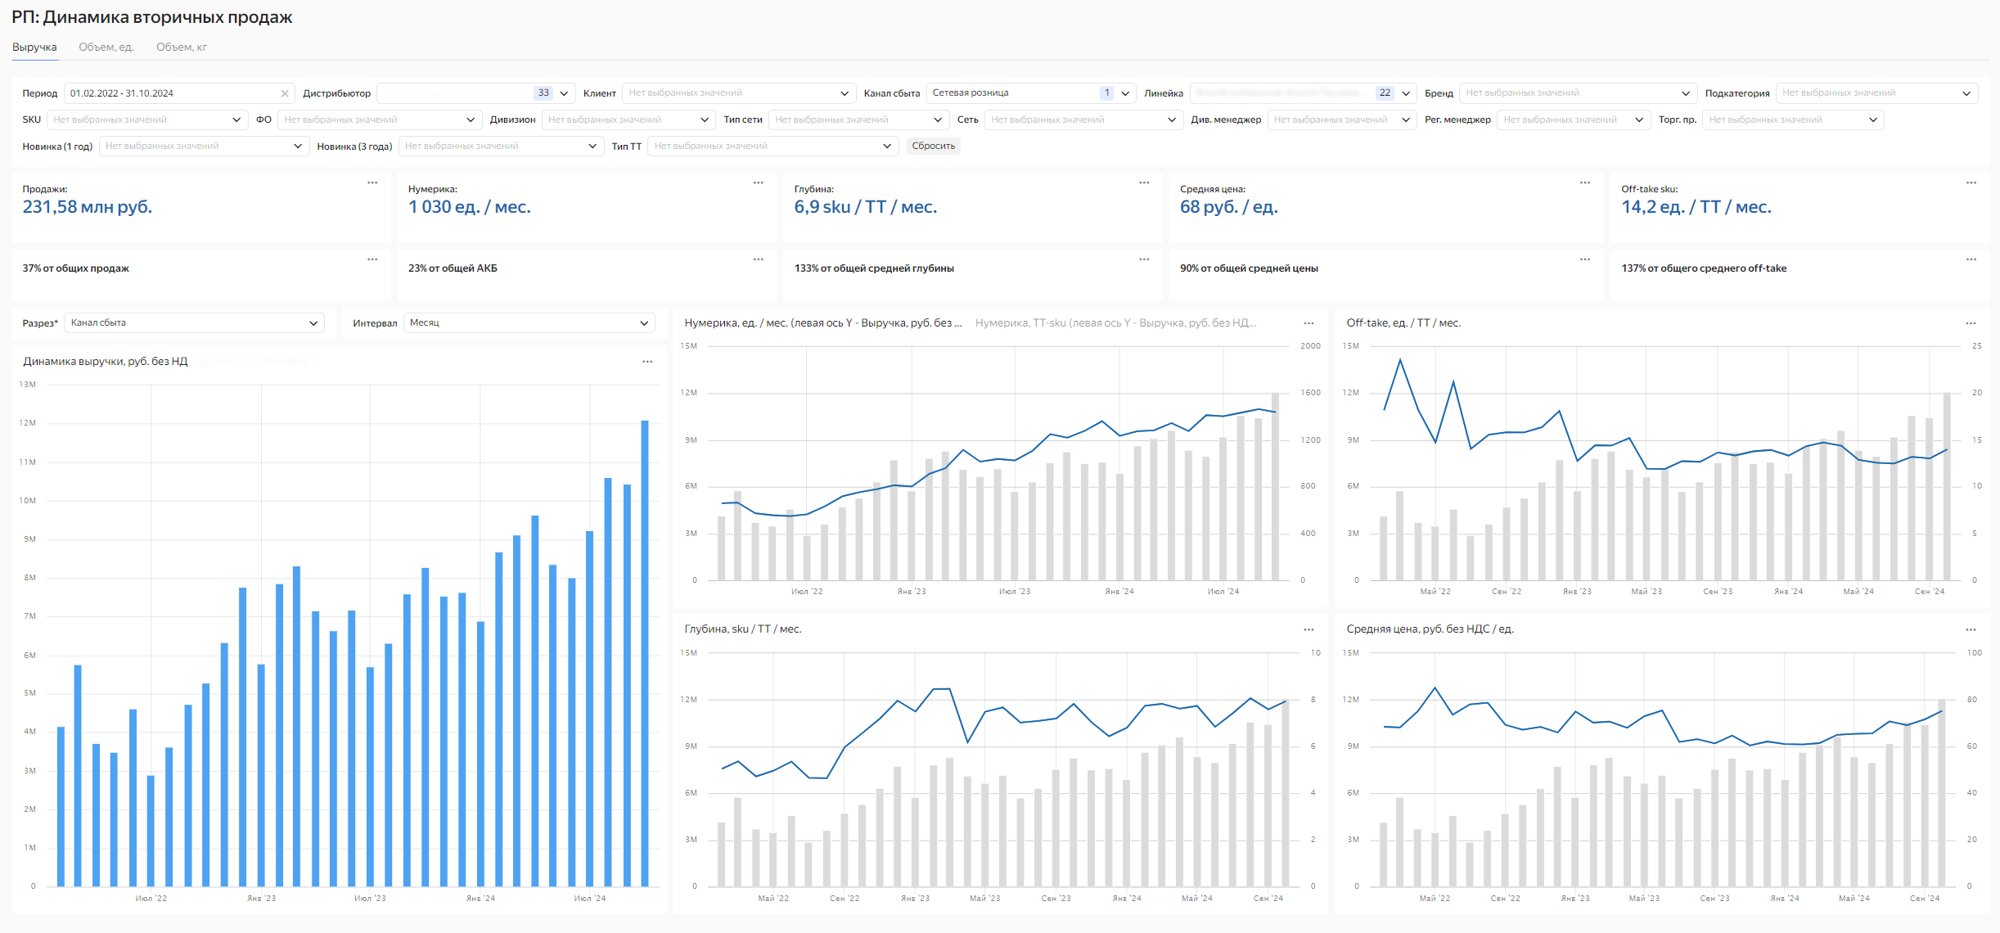
• Analysis of Secondary Sales Dynamics for Distributors: Analyzing down to the retail point level across various dimensions based on key factors: numeric data, depth, sales volume by SKU (unique stock keeping unit), average price.
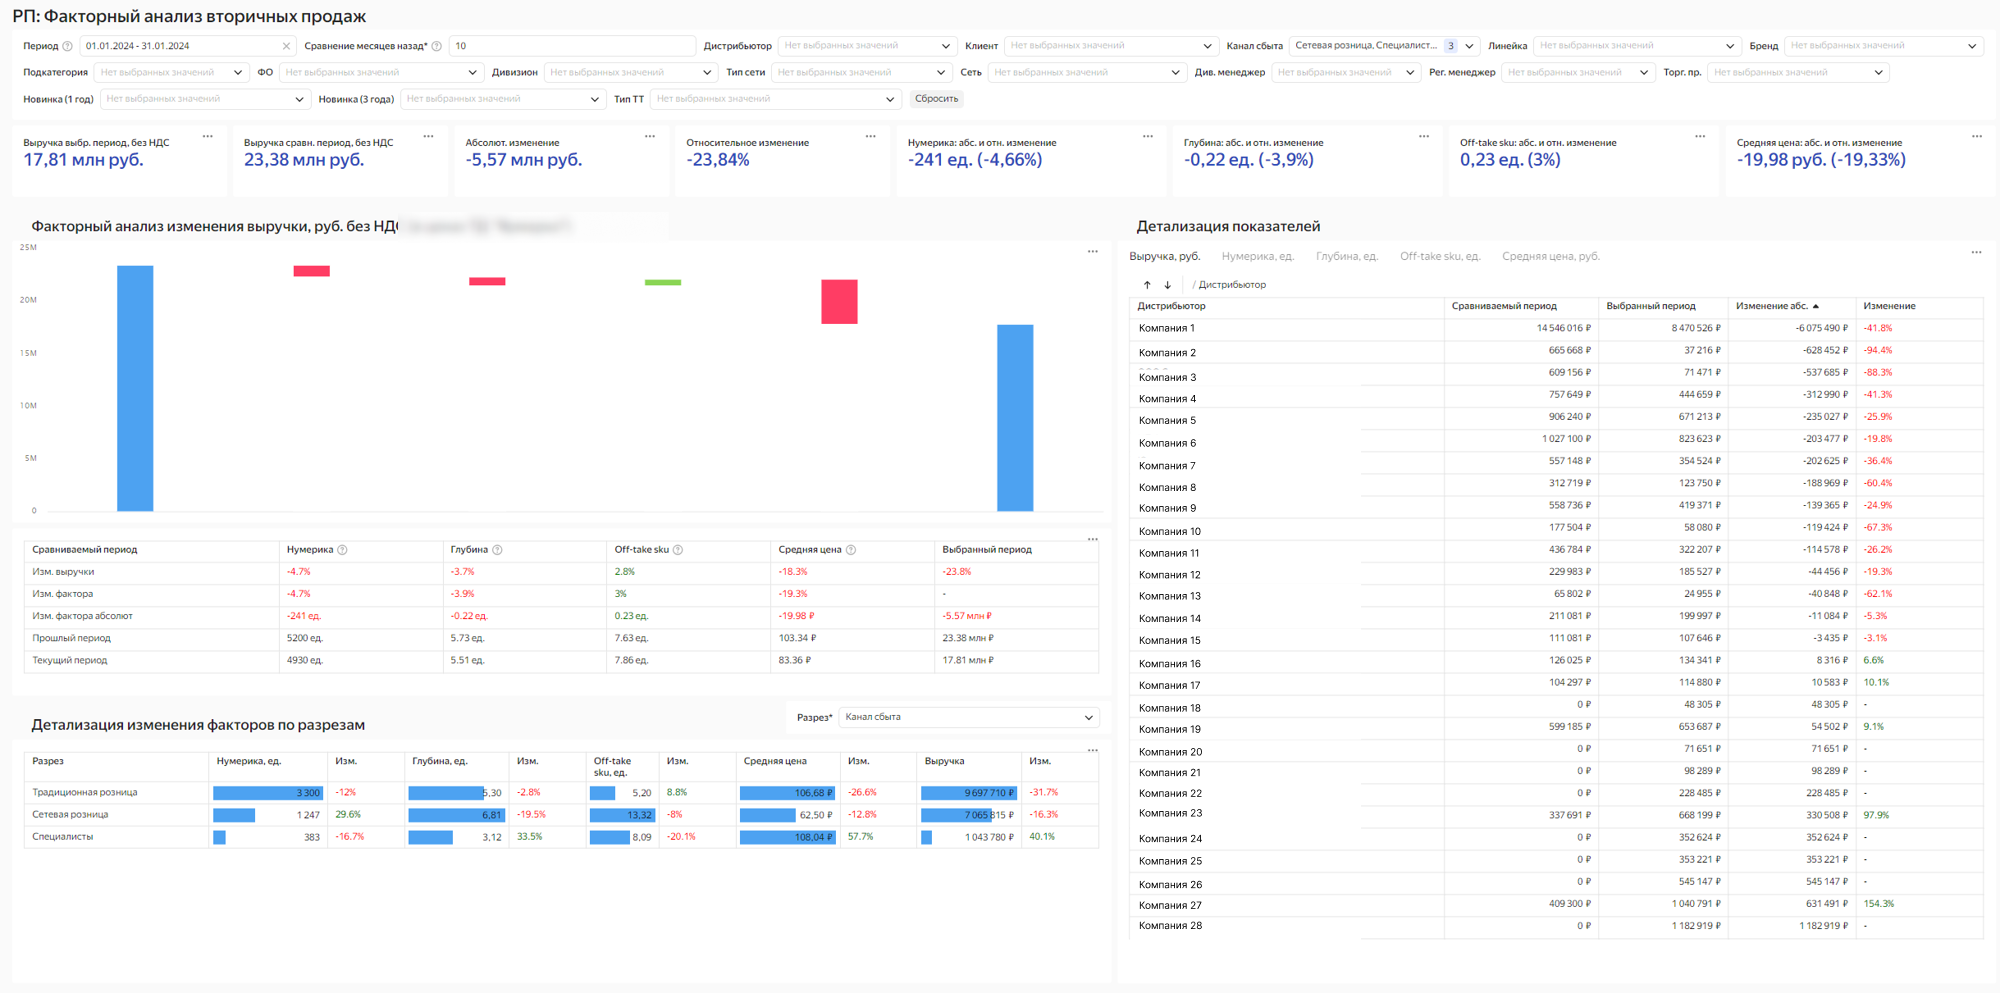
• Factor Analysis of Secondary Sales for Distributors: Comparing results between different periods based on sales factors down to individual distributor clients.
• Product Efficiency Analysis: Visualizing the entire range of supplied products.
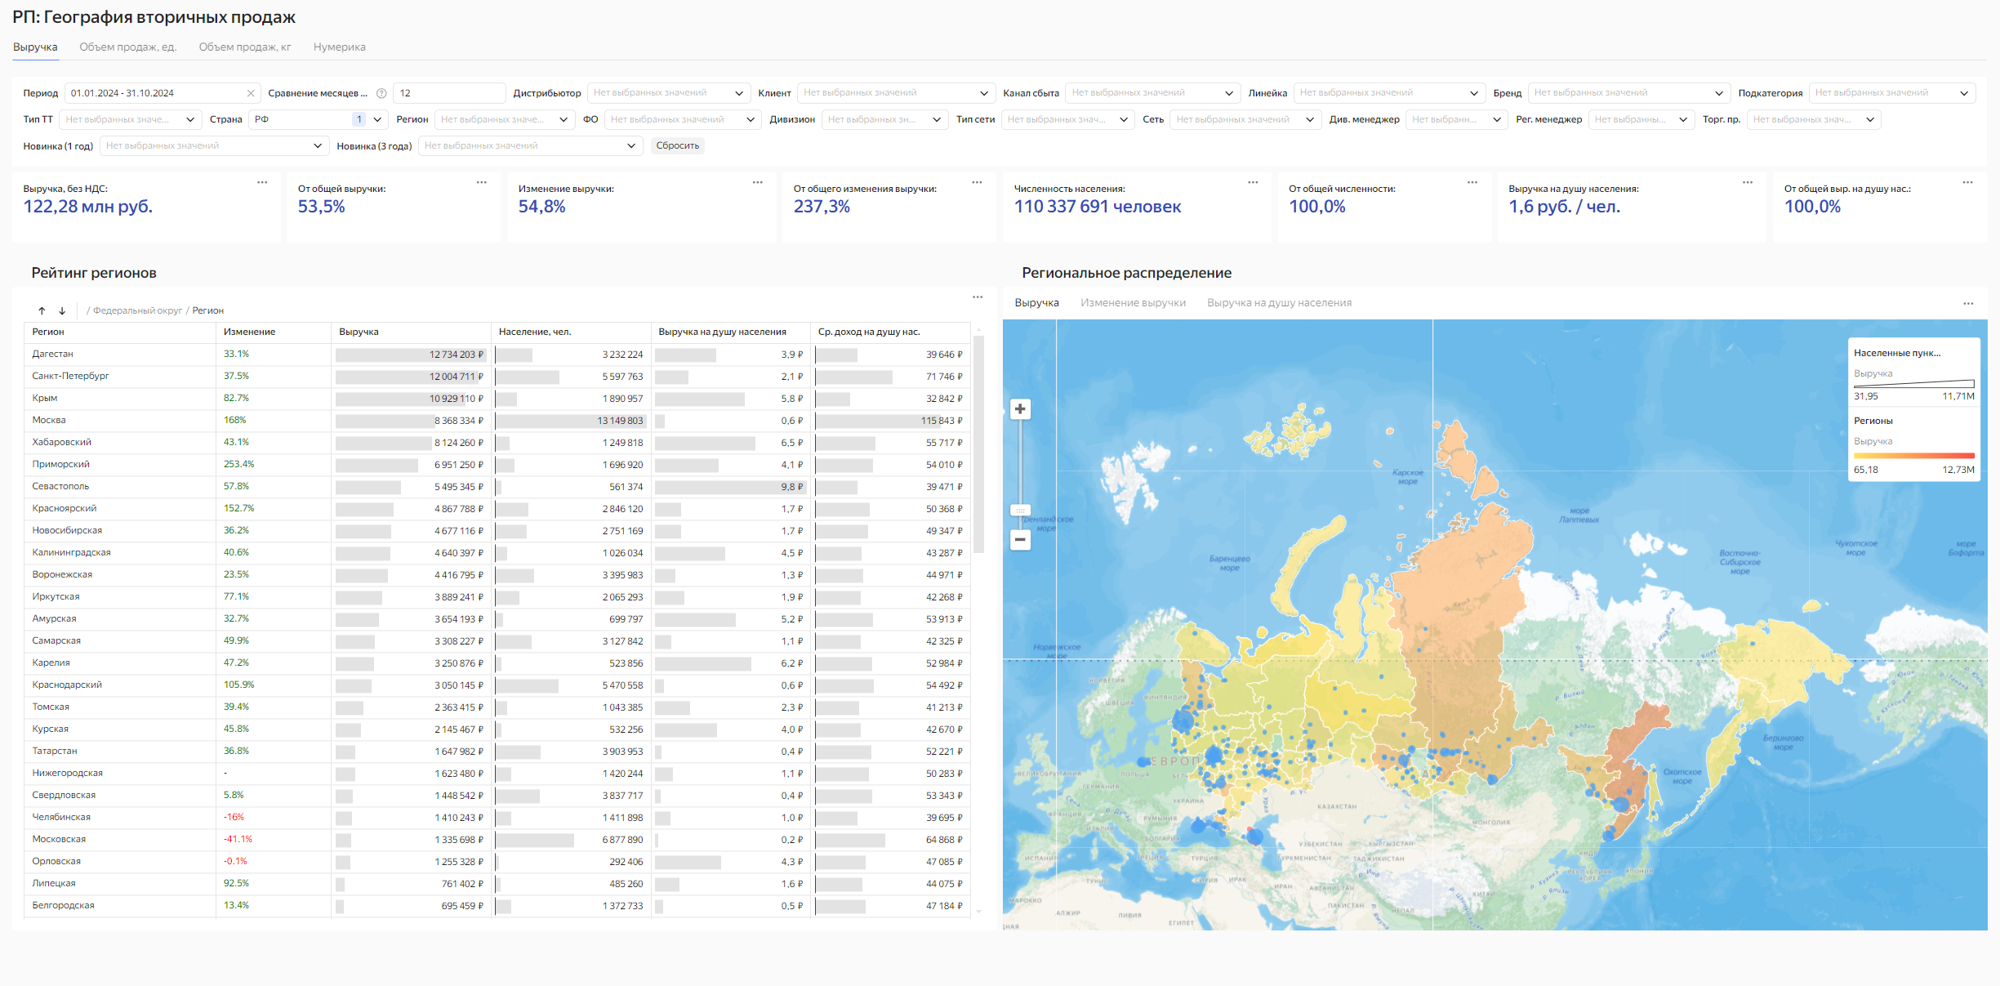
• Geographical Analysis of Secondary Sales: Relative comparison of sales by cities and regions linked to population size and average per capita income.

The conclusion is as follows:
The selected services quickly compute data and visualize sales information with attractive graphs and charts. This case is illustrative and straightforward – we successfully consolidated data and set up streams for analytics that allow commercial division management to identify:
• Paths for sales growth,
• Areas for enhancing distribution,
• Strategies for expansion and stimulation of sales in specific regions, and much more.
.jpg&w=1024&q=75)